One simple yet effective method for testing estimation sensitivity is to run a jack-knife analysis, wherein a sample or set of samples is intentionally removed from a dataset, an estimation is performed in the location of the missing samples, and the estimated result is compared back to the samples. The tools and workflow built into Leapfrog EDGE make this a simple operation to perform at a block level by comparing the results of two different estimations.
- Create A Standard Estimator
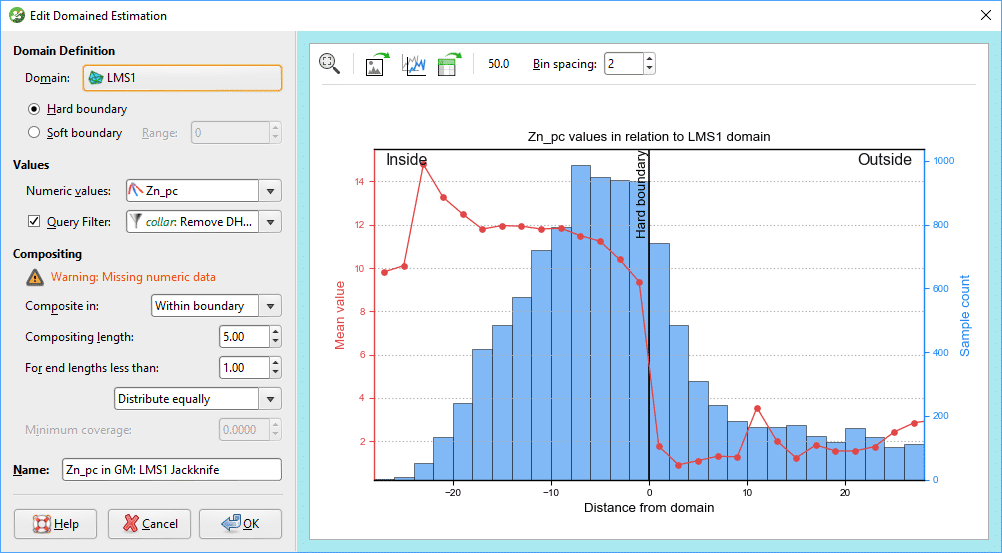
The first step to running a jack-knife is to create an estimator using all data required. For this example I will use the LMS1 domain from the Leda training dataset, and will be estimating the Zn grades within that volume.
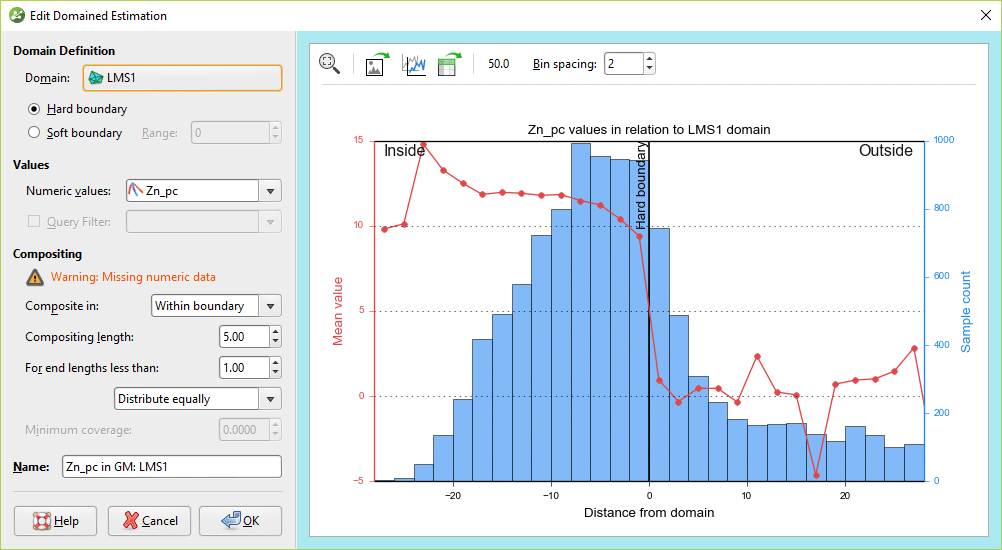
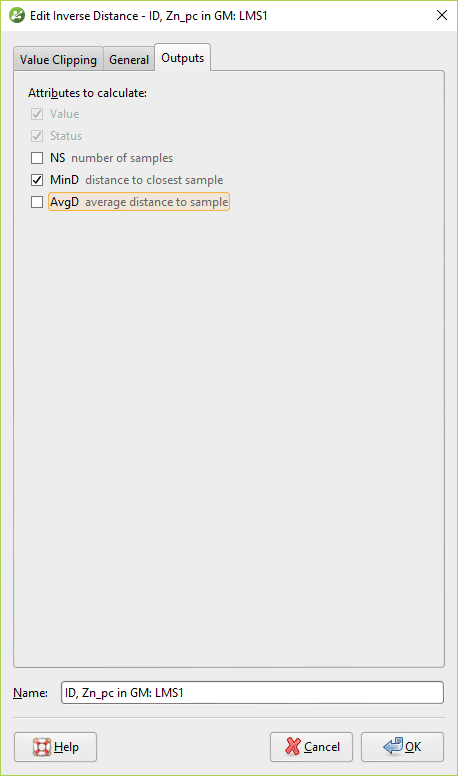
Set everything else up in a typical fashion – run variography, declustering, and create the desired estimator objects. Be sure to store the MinD value for each estimator you create.
At this point it wouldn’t be inappropriate to build a block model and evaluate this estimator onto the blocks, or this step can be done once all estimator objects are ready to evaluate.
2. Find Drillholes to Remove and Create a Filter
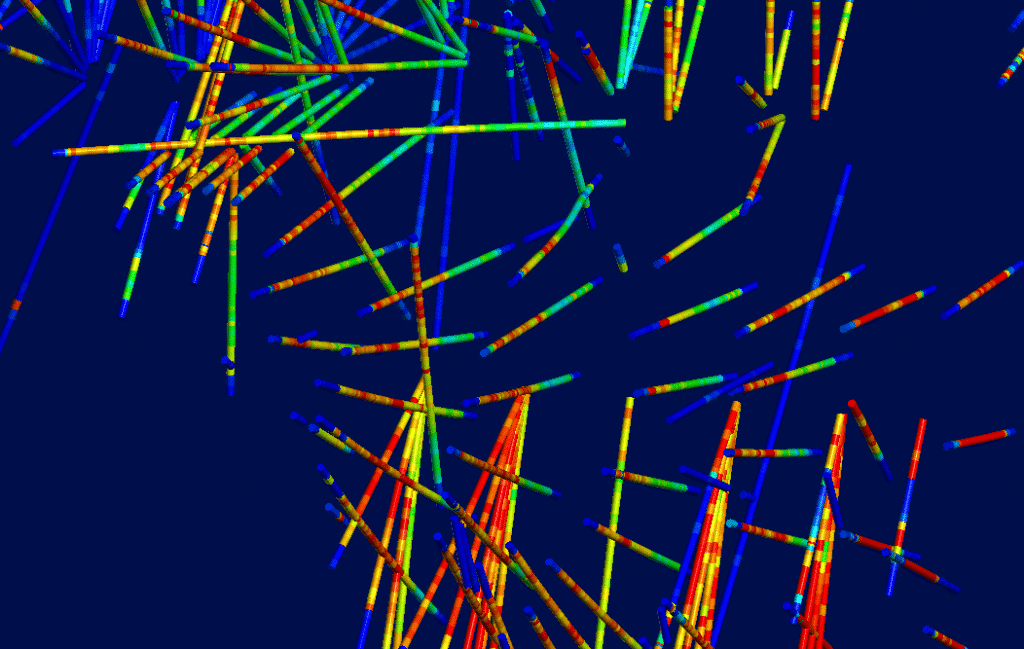
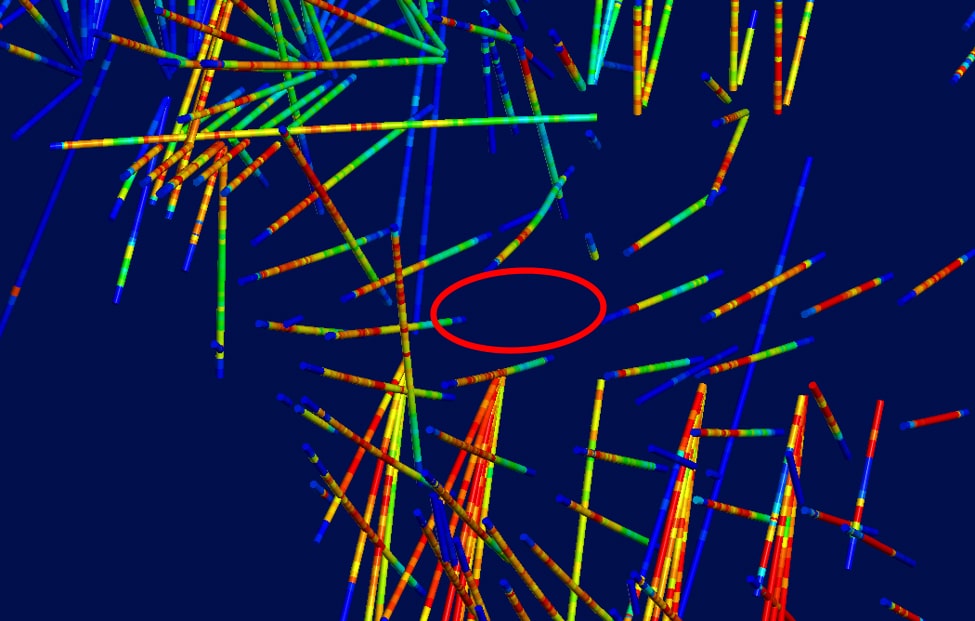
In the core of the LMS1 volume the drilling density is relatively high. As such, for this study I want to pick a drillhole near the dense data but not in the thick of it. There is a series of underground drilling fans with some less-dense drilling nearby, so I will pick one of those holes.
The hole I will leave out of the second estimation is Hole DHUG0184, so I will have to create a filter to exclude that hole from the estimators. I will build the query filter on the Collar table, though it would be fine to build it directly on the Assay table as well.
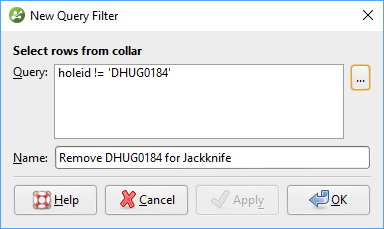
Certainly, multiple drillholes could be selected at this step as well, depending upon the intent of the jack-knife study.
I’ll activate the query filter on the drillholes in the scene to make sure I’ve removed the expected drillhole, which does appear to be the case.
3. Copy the Existing Estimator and Apply the Filter
Since we want to see if our estimated results correlate with known values, we will want to use the same parameters for our filtered estimator as for our original estimator. As such, copy the estimator to study and add “Jack-knife” to the name, or something that makes it clear how that estimator is different from the original. (If running multiple studies, it would be a good idea to name according to the filter or drillhole that is being applied or removed to keep track of the various results.)
Build a block model (if not done in step 2 or previously) and evaluate this estimator object onto the blocks.
4. Create a Filter to Identify the Nearest Estimated Blocks to the Missing Drillhole
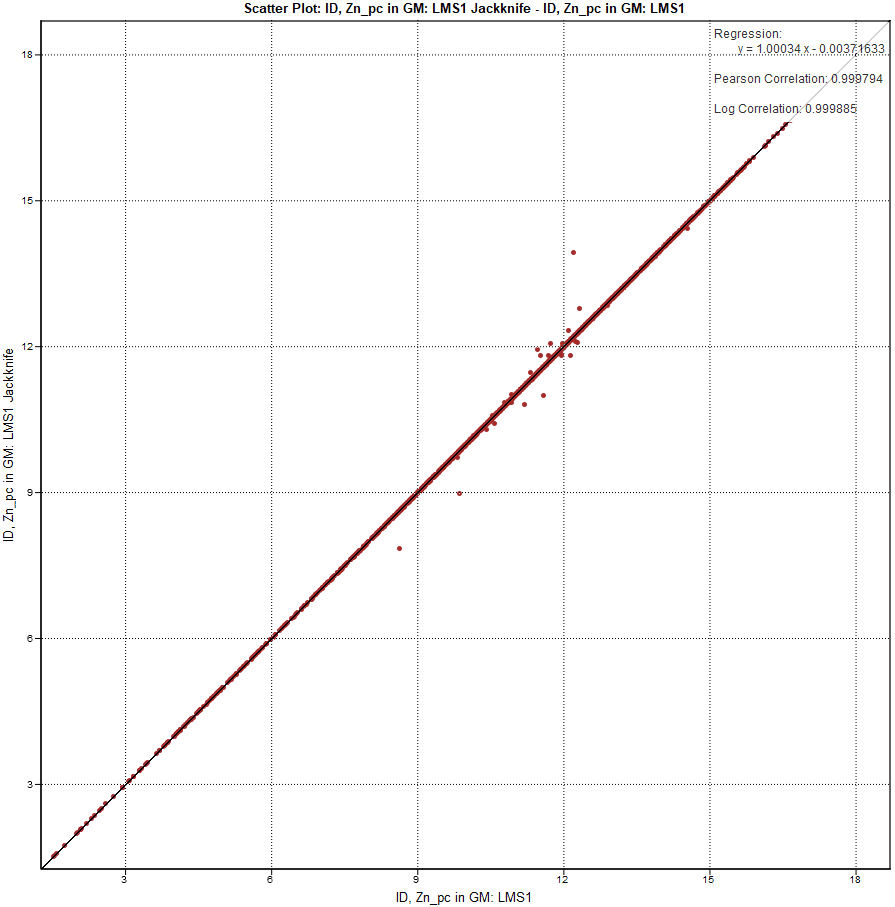
At this point we will have two estimators that, for the most part, will be identical. Scatter plots comparing the estimated values will have slight deviation but should be largely the same.
We need to hone in on the blocks that experienced the most direct influence by the removal of the drillhole, so we will create a filter based on the MinD values we stored in the blocks. It is an inequivalence filter, so it should look something like this:

To explain the filter, we want to see blocks where the minimum distance to a sample from the original estimate is not the same as the minimum distance to the filtered Jack-knife estimate. (Note: this is not a “traditional” jack-knife method, as that would require the block values to be evaluated back to the composites or drillholes; EDGE does not yet allow for this type of evaluation.)
5. Examine the Blocks In the Scene and Run Statistical Analysis Using the Filter
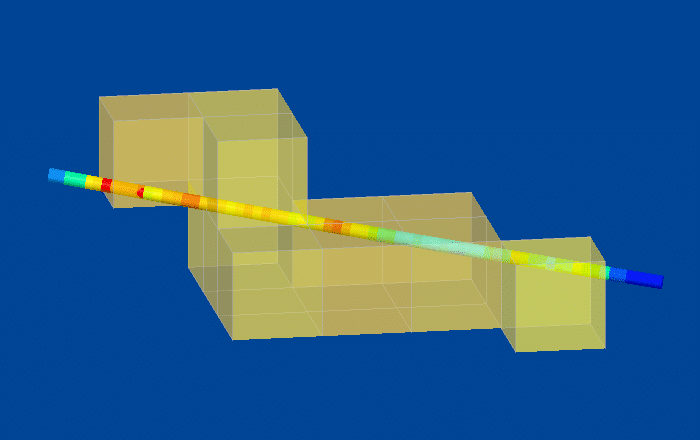
Once the filter is created and saved, the first step will be to return to the Scene view and verify the results of the filter. Load the blocks using any variable, and apply the filter in the Properties Panel. It should show only those blocks directly adjacent to the filtered drillhole.
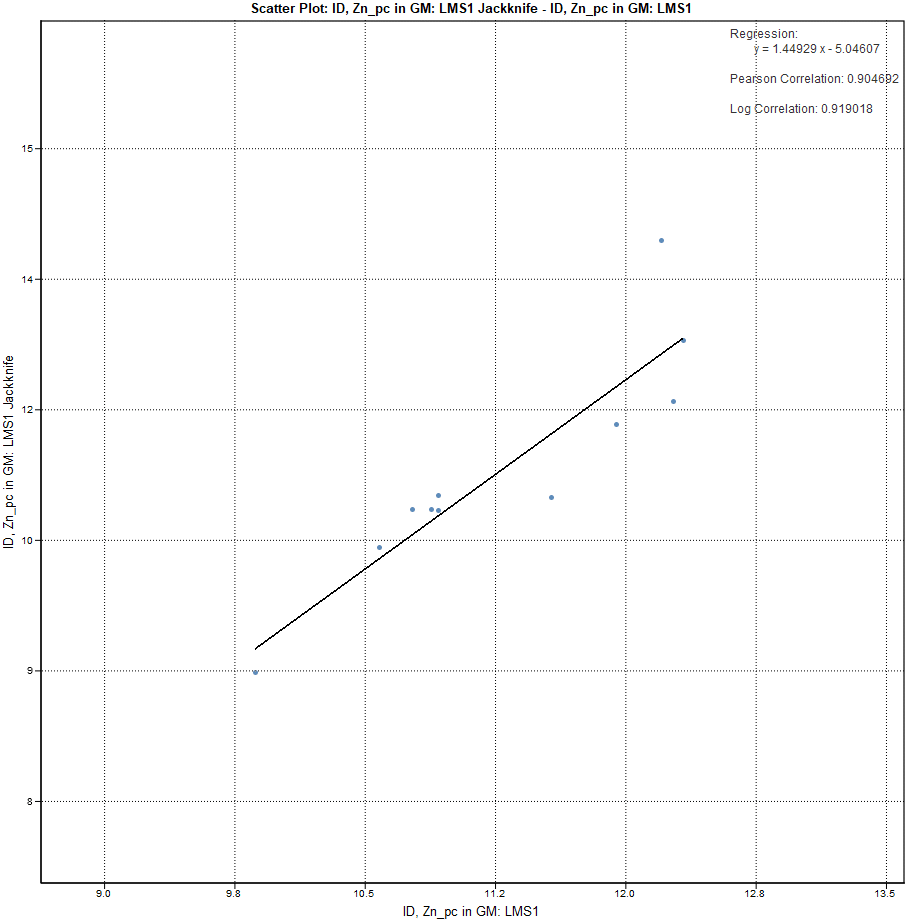
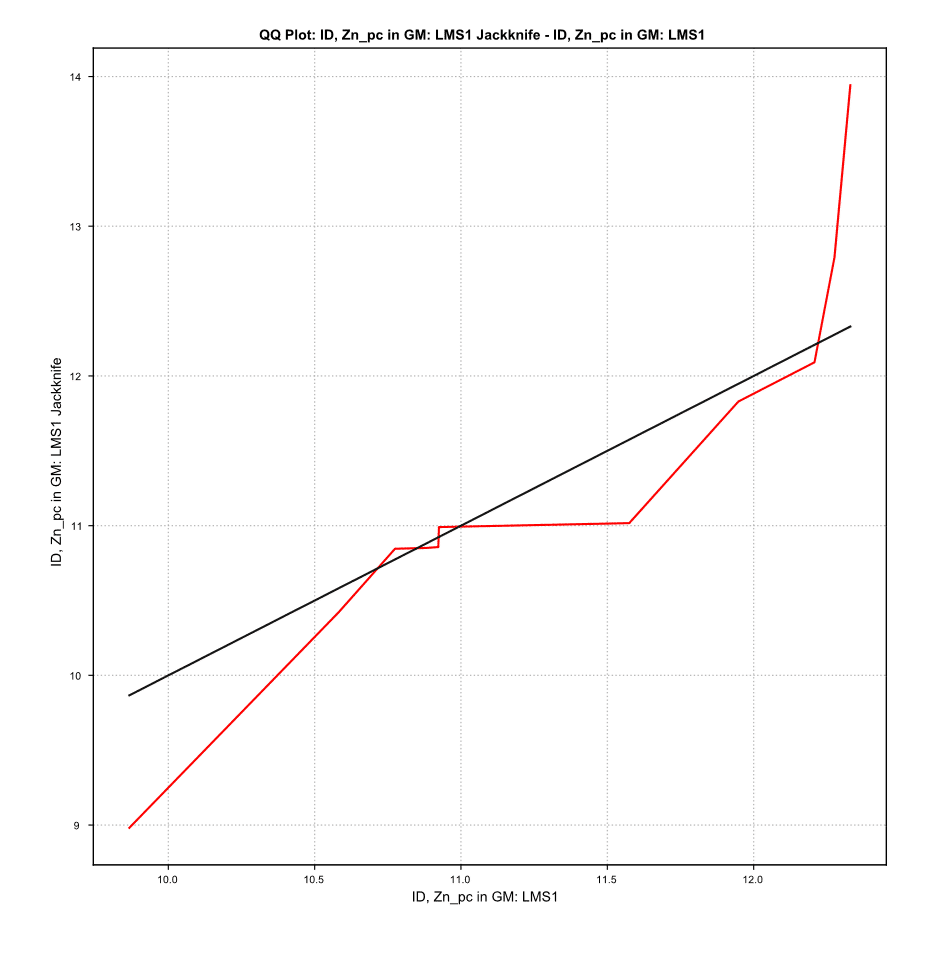
If the blocks match our expectation of proximity to the filtered drillhole(s), we can move on to statistical analysis. Check the block grades using scatter plots, QQ plots, or any other statistical tool provided in EDGE to understand how the estimate is behaving in an area of known data.
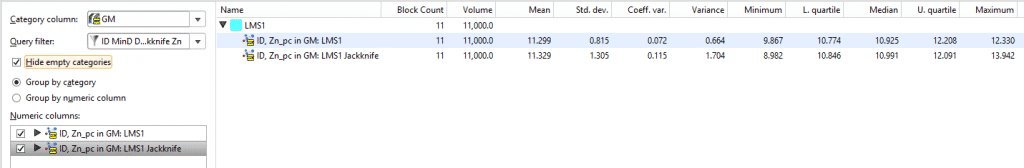
Another good method for checking the differences would be to set up a calculation subtracting the values from the Jack-knife estimator from the Original Estimator:

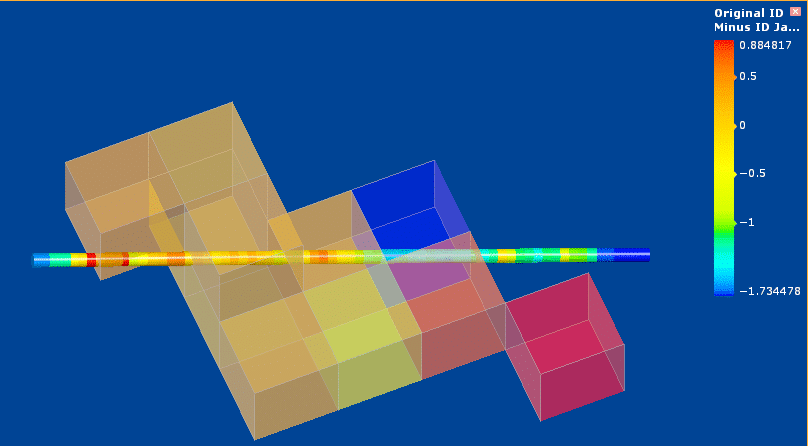
From my results, it appears that my estimation is not highly sensitive to local variability; I have only a couple of blocks with significant deviation from the estimated value when the drillhole was removed.