Today’s guest contributor is Tick Knight, a consulting mining geologist with over 40 years’ experience in grassroots exploration and mine geology in the US and Western Europe. His career began in mapping and deciphering complex ore-controlling structures in the Balmat-Edwards-Pierrepont zinc district in northern New York State. His consulting practice, Mining Geology Solutions, is primarily focused on optimising mining geology practices and overseeing in-mine and brownfields exploration programmes.
As a mine geologist, I have been promoting the use of Leapfrog in mines since I began using Leapfrog Mining in 2005. I first learned of Leapfrog in late 2004 when I was looking for a less painful way to model geometrically-complex orebodies. I invited myself to a GOCAD user group meeting and after struggling through the demo session, I bought one of the more experienced users a beer, and he asked me: “Have you heard of Leapfrog?” This led me to correspond with and receive active support from the developers of Leapfrog, who were at that time developing Leapfrog Mining’s vein modelling functionality.
In 2006, I presented my MSc dissertation findings at the AusIMM mining geology conference in Darwin, Australia. My study concluded that Leapfrog’s ‘implicit’ vein modelling workflow was much more efficient and that the vein models were just as accurate as wireframes generated using ‘explicit’ methods employed by traditional general mine planning software packages (GMPs). A key ingredient in my study was the use of various sets of ‘interpretation’ polylines to create (and constrain) multiple, geologically-realistic, hard-boundary shells. Each alternative shell was generated in a matter of just a few minutes. Since then I have continued to explore novel applications of Leapfrog’s unique functionality.
I have used Leapfrog in various ways: for assisting in transitioning project exploration geologists from working in 2.5 D to working in 3D production geology; for training younger mine geologists; for auditing mining geology methods; for designing mine mapping and ore control systems; for performing preliminary project reviews; and for integrating various types of legacy data in the evaluation of inactive mines. Since a large share of my consulting time is currently spent working alongside mine geologists at the face, I primarily use Leapfrog as a platform for reviewing their drilling, mapping, and sampling data, and for illustrating various ways of optimising their mine mapping and ore control procedures. On occasion, I generate deliverable resource domain models and help clients to build Leapfrog models.
Reducing geological uncertainty
It has been said that the key objective of mining geology is to reduce risk associated with geological uncertainty in order to ensure that ore value and mining operation revenue are maximized. There are two main ways that geological uncertainty can be reduced in mining geology: 1) by increasing orebody knowledge, and 2) by improving the accuracy and efficiency of ore control. I use Leapfrog to pursue both of these ends in order to reduce geological uncertainty.
Robust mine mapping, compilation, and interpretation of ore-controlling features and their geological relationships increase orebody knowledge that, in turn, informs resource modelling and improves the predictions that guide ore control, development and stope planning, and drill targeting. As mines have come to rely solely on ‘the (digital) model’ in recent years, I have seen the quality of mine mapping and its geological compilation and interpretation decrease. This is unfortunate since, in light of advances in AI-based automation in mining, the core skills of a mine geologist remain to be those of sound geological mapping and interpretation.
Translating old school methods to 3D
In my consulting work, I consider the training and mentoring of younger mine geologists to be most important. Today, I believe that the mining geology profession faces two main challenges: 1) to close the experience gap, and 2) to maintain sound mine geology practices as mines become digital.
I use Leapfrog Geo to help address both of these challenges. Geo’s functionality enables the appropriate translation of traditional ‘old-school,’ paper-based mine geology methods and physical modelling techniques to the digital 3D environment that is second nature to younger mine geologists. These traditional methods are well documented in Hugh McKinstry’s classic book, Mining Geology, published in 1948. I highly recommend this book, since, in my opinion, it is the sole source of numerous gems of practical mining geology wisdom.
In recent years, I have seen a significant increase in Leapfrog use at operating mines. In order to maintain high-quality mine geology practices, I use Leapfrog’s unique functionality (that extends beyond that of traditional GMPs) to reduce geological uncertainty by increasing the accuracy and efficiency of mining geology methods. For example, I use Leapfrog Geo’s 3D polyline tool, distance function option, and OBJ textured mesh import ability to perform various 3D mapping, interpretation, and modelling tasks.
Here are some examples of how Leapfrog Geo’s unique functionality allows me to translate ‘old-school’ interpretation techniques into the digital environment.
Mapping-based approach to geological continuity prediction
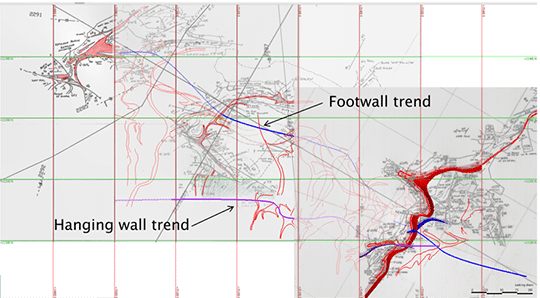
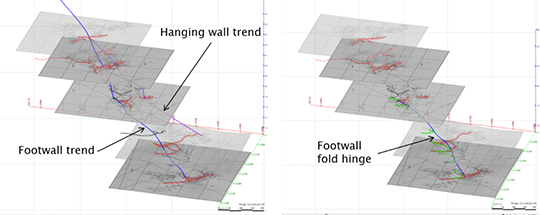
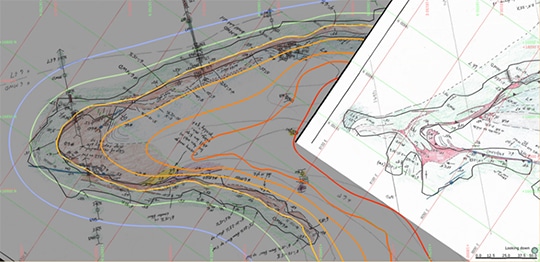
I have used Leapfrog to address the observed decline in the quality of mining geology practices by developing what I have described in a paper as ‘a mapping-based approach to geological continuity prediction.’ More precisely, my approach emphasises the importance of mine mapping, compilation, and interpretation. The title of my presentation, which I gave at the 2014 AusIMM mining geology conference in Adelaide, was: ‘From linen…to Leapfrog.’ Before mine mapping observations were drafted on mylar using Leroy lettering sets, observations were carefully drawn on linen using quill pens. My mapping-based approach emphasises traditional, careful observation and mapping methods and incorporates a novel 3D interpretation technique. This technique uses Leapfrog Geo’s 3D polyline tool to link various ore-related features, mapped on each mine level, to establish a predictive, empirical 3D geometrical framework, upon which various explanatory theoretical models can be evaluated. As I explain in my paper, the applied science practised by mine geologists is, by nature, necessarily predictive, not explanatory. My framework provides a practical tool for making timely decisions at multiple advancing faces in various orebodies on a daily basis. In addition, the ore-related 3D polylines, used to construct the framework, can serve as a guide that ‘informs’ geologically-reasonable resource domain modelling, as opposed to relying upon the arbitrary ‘explicit’ tie lines of GMPs. The two images below illustrate 3D polylines used to construct the geometrical framework.
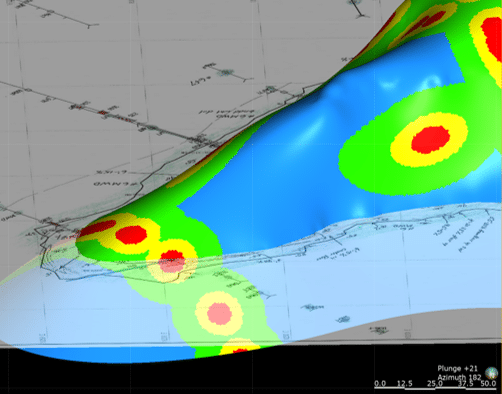
Connolly diagrams & Leapfrog Geo’s distance function
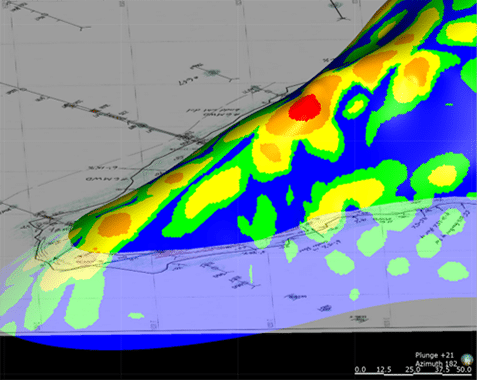
Connolly diagrams have been used for years to represent vein orientation changes that coincide with pitching ore shoots. Using Leapfrog, I simply highlight areas where the mesh face dip changes, or, as a check, I evaluate the distance from a reference plane, from a reference surface, or from a very low-resolution version of the mesh, using the distance function (see Image 3). This also allows me to identify areas of geometric complexity that may require a tighter drill spacing to resolve. Similarly, drill spacing can be reviewed by evaluating the drill hole distance function on a target surface (see Image 4).
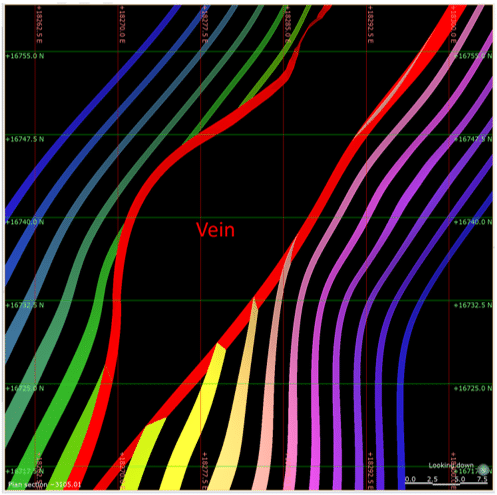
Plunge projection & Leapfrog Geo’s structural surfaces
Another traditional technique is ‘plunge projection.’ After georeferencing paper or digital mapping, I use the polyline tool to trace or digitise oriented ore contacts (along with adding structural measurements) on each mine level and create ‘structural surfaces.’ Contours can be created from the resulting ‘form surfaces’ on intermediate and lower levels where mapping information is missing (see Image 5). This provides a prediction of ore location, orientation, and configuration that assists in drill hole and development planning. In addition, the accuracy of the geological continuity of these ‘form surfaces’ can be improved by digitising 3D polylines representing fold hinge lines, or other mapped linear geological features.
Form line mapping & Leapfrog Geo’s form interpolants
Traditional ‘form-line mapping,’ combined with Geo’s ‘form interpolants,’ generated from mapped structural measurements, is another technique that I use to increase the accuracy of ore prediction on a daily round-by-round basis, or to inform the configuration of resource domains. Mapping and visualisation of wall rock structure, as well as vein architecture, may foretell immanent changes in strike or vein character that improves the accuracy of geological prediction at the face (see Image 6).
Mapping in 3D & Leapfrog Geo’s OBJ textured mesh import functionality
Recently, I have taken traditional 2D mine mapping a logical step further by simply mapping in 3D. My method of 3D mine mapping integrates photogrammetric imaging with Leapfrog Geo’s polyline tool and OBJ textured mesh import functionality. Using the polyline tool, I digitise contacts of ore and ore-related geological features directly on photorealistic 3D images that have been imported into Geo as textured meshes (see Image 7). Mapping the location, orientation, and configuration of each geological feature in its actual 3D location eliminates the geological uncertainty introduced by manual, ‘eye ball’ sketching of spatial relationships and by their projection to an arbitrary 2D mapping plane. I have summarised this approach in a couple of papers that I gave in Santiago, Chile and, later, at the AusIMM’s mining geology conference in Tasmania in September 2017.
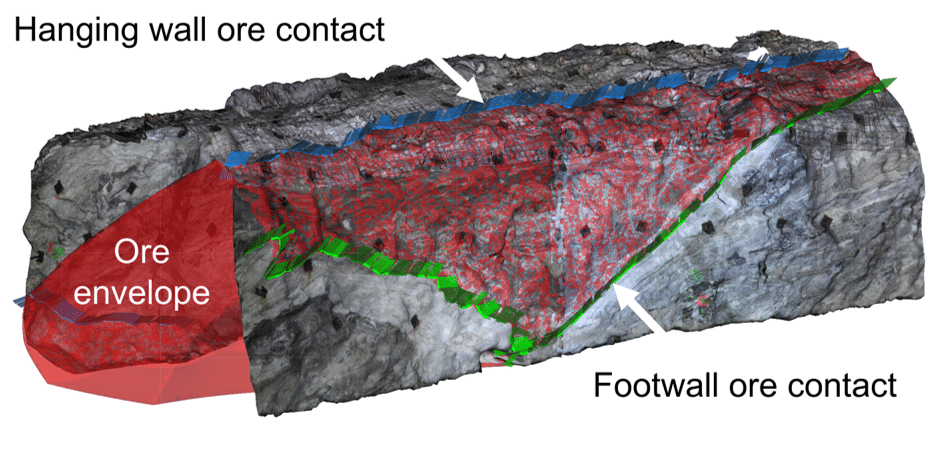
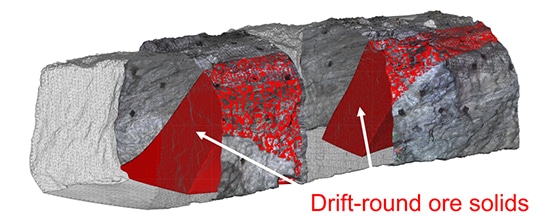
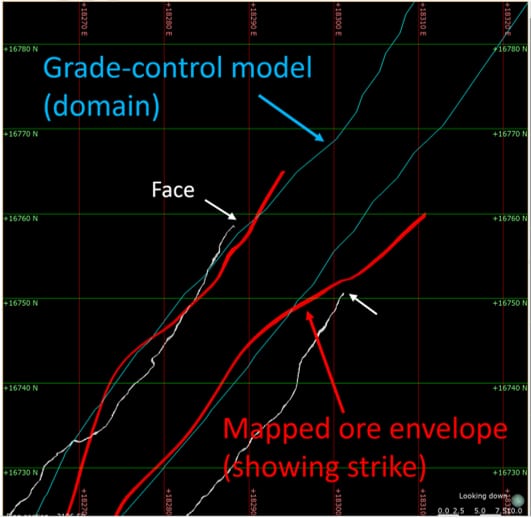
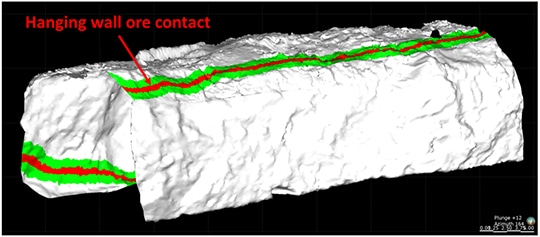
Mapping directly to model
In Leapfrog Geo, using 3D imagery, I map directly to model, which eliminates the need for less accurate CAD-based digitising. 3D photorealistic images are taken underground on a round-by-round basis. Once 3D images are processed and imported into Leapfrog Geo, ore contacts are digitized directly on the 3D image and the ore envelope is modelled within the closed drift-round mesh (see Image 8). Drift-round and ore volumes (and tonnages) are determined, and dilution is calculated. These accurate volumes (with properly attributed grades) can be used for round-by-round reconciliation and for updating ‘evergreen’ grade control models. Slicing the Leapfrog ore solid at an appropriate reference elevation above the sill provides a strike line that is used to confirm the geological guidance provided at the face (see Image 9). By applying the distance function in Leapfrog Geo to the particular ore/vein surface used by engineering for stope planning, and then evaluating the interpolant on the surveyed heading mesh, the geologist can track and maintain proper vein placement in the development drive to reduce dilution and optimise stope planning (see Image 10).
Addressing unique mining geology issues
I use some of the same techniques to audit mining geology practices at various client operations, to set up mine mapping and ore control systems that are tuned to the level of geometric complexity of the ore, to perform preliminary desktop project reviews, and to integrate and analyse legacy data from previously operating mines. Leapfrog Geo provides additional functionality that is not available in standard GMPs. This functionality allows me to identify, evaluate and address unique mining geology issues that I encounter at various client mining operations.
The changing role of the mine geologist
As the entire mining process becomes increasingly automated, it is clear that the role of the mine geologist will change. I anticipate that the efficiency and output accuracy of currently available photogrammetric or laser-scanning systems will continue to improve, and that they will be fitted with various types of co-aligned sensors (e.g., hyperspectral, etc.). This advance will enable automatic image classification and geologic feature (lithology, structure, alteration and mineralisation) delineation and extraction. Extracted portions of the 3D image will be automatically correlated with features extracted from similar drill hole optical and hyperspectral imagery and integrated into an updated 3D model in Leapfrog Geo. Mobile, high-speed scanning systems will have minimal impact on the mining cycle. These systems will provide for efficient, automatic drift-round and face ore grade estimation, as well as geometallurgical and environmental ore characterisation.
I believe that the primary role of the mine geologist in the future will be to vigilantly ground truth, validate, and refine automated AI-based image analysis and modelling by visiting active mine faces, by observing and confirming geological relationships, by performing sound 3D geological interpretation, and, of course, by verifying the accuracy of ore grade/quality and tonnage estimation. All these tasks will be supported by AR technology that will enable visualisation and evaluation of alternative geological models superimposed upon freshly mucked faces.
Ore controls and geological relationships will change as mine development advances on deeper levels. AI algorithms will need to be updated and tuned to these changes that are observed and documented by the mine geologist at the face. This underscores the statement, repeated at a recent mining geology conference, that the key skills of the future mine geologist will continue to be mapping and interpretation. I believe that Leapfrog Geo’s evolving functionality will continue to enhance these vital skills, especially as automation increases in the future.
Tick Knight is a consulting mining geologist with over 40 years’ experience in grassroots exploration and mine geology in the US and Western Europe.